Web Dashboard Setup
Learn how to access and configure the TreeMapper web dashboard for analytics, team management, and reporting.
Accessing the Web Dashboard
The TreeMapper web dashboard provides a powerful interface for managing your projects, viewing analytics, and coordinating team activities. Access it through your web browser on any desktop and tablet device.
System Requirements
- Browser: Chrome, Firefox, Safari, or Edge (latest versions)
- Screen: Works on all screen sizes, optimized for desktop
- Internet: Active internet connection required
- Account: TreeMapper account with appropriate permissions
Getting Started
1. Navigate to the Dashboard
Open your web browser and go to the TreeMapper dashboard URL: https://dash.treemapper.app
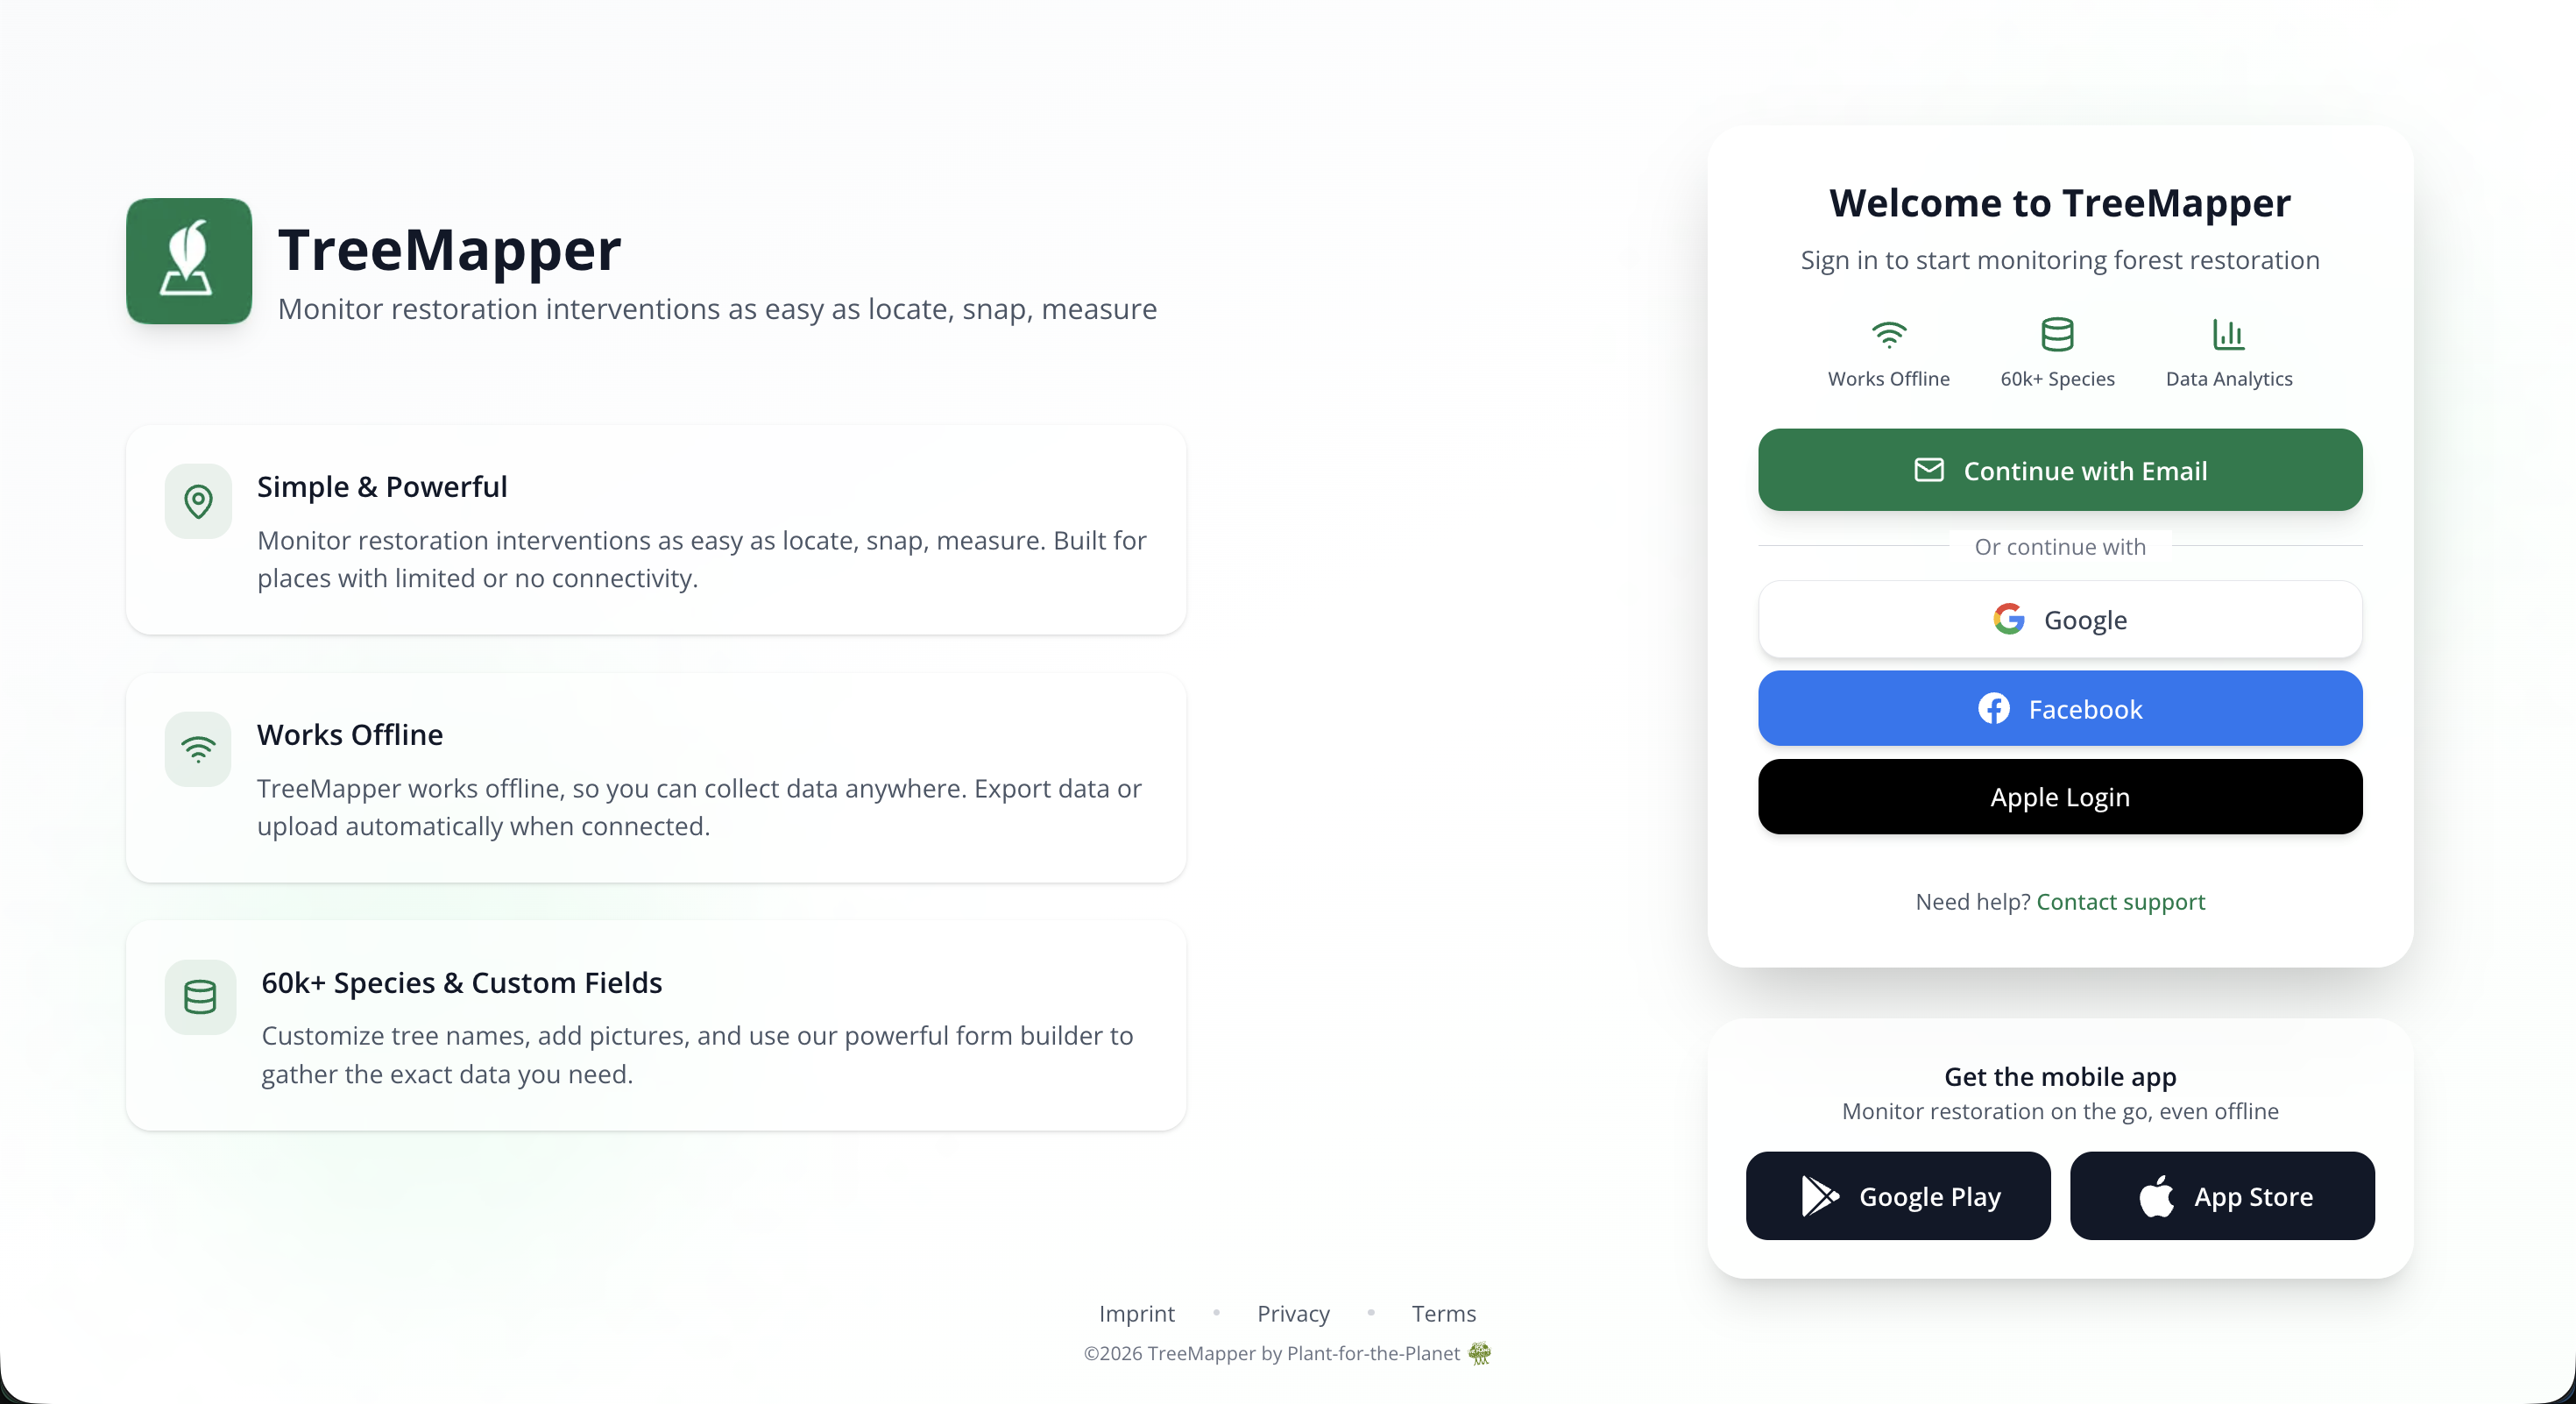
2. Sign In
Sign in using one of these methods:
- Email & Password: Use your TreeMapper credentials
- SSO: Single sign-on if configured by your organization
- Social Login: Google or other providers if enabled
Tip
Use the same credentials as your mobile app to sync data seamlessly between devices. If you don't have an account yet, contact your project administrator for an invitation.
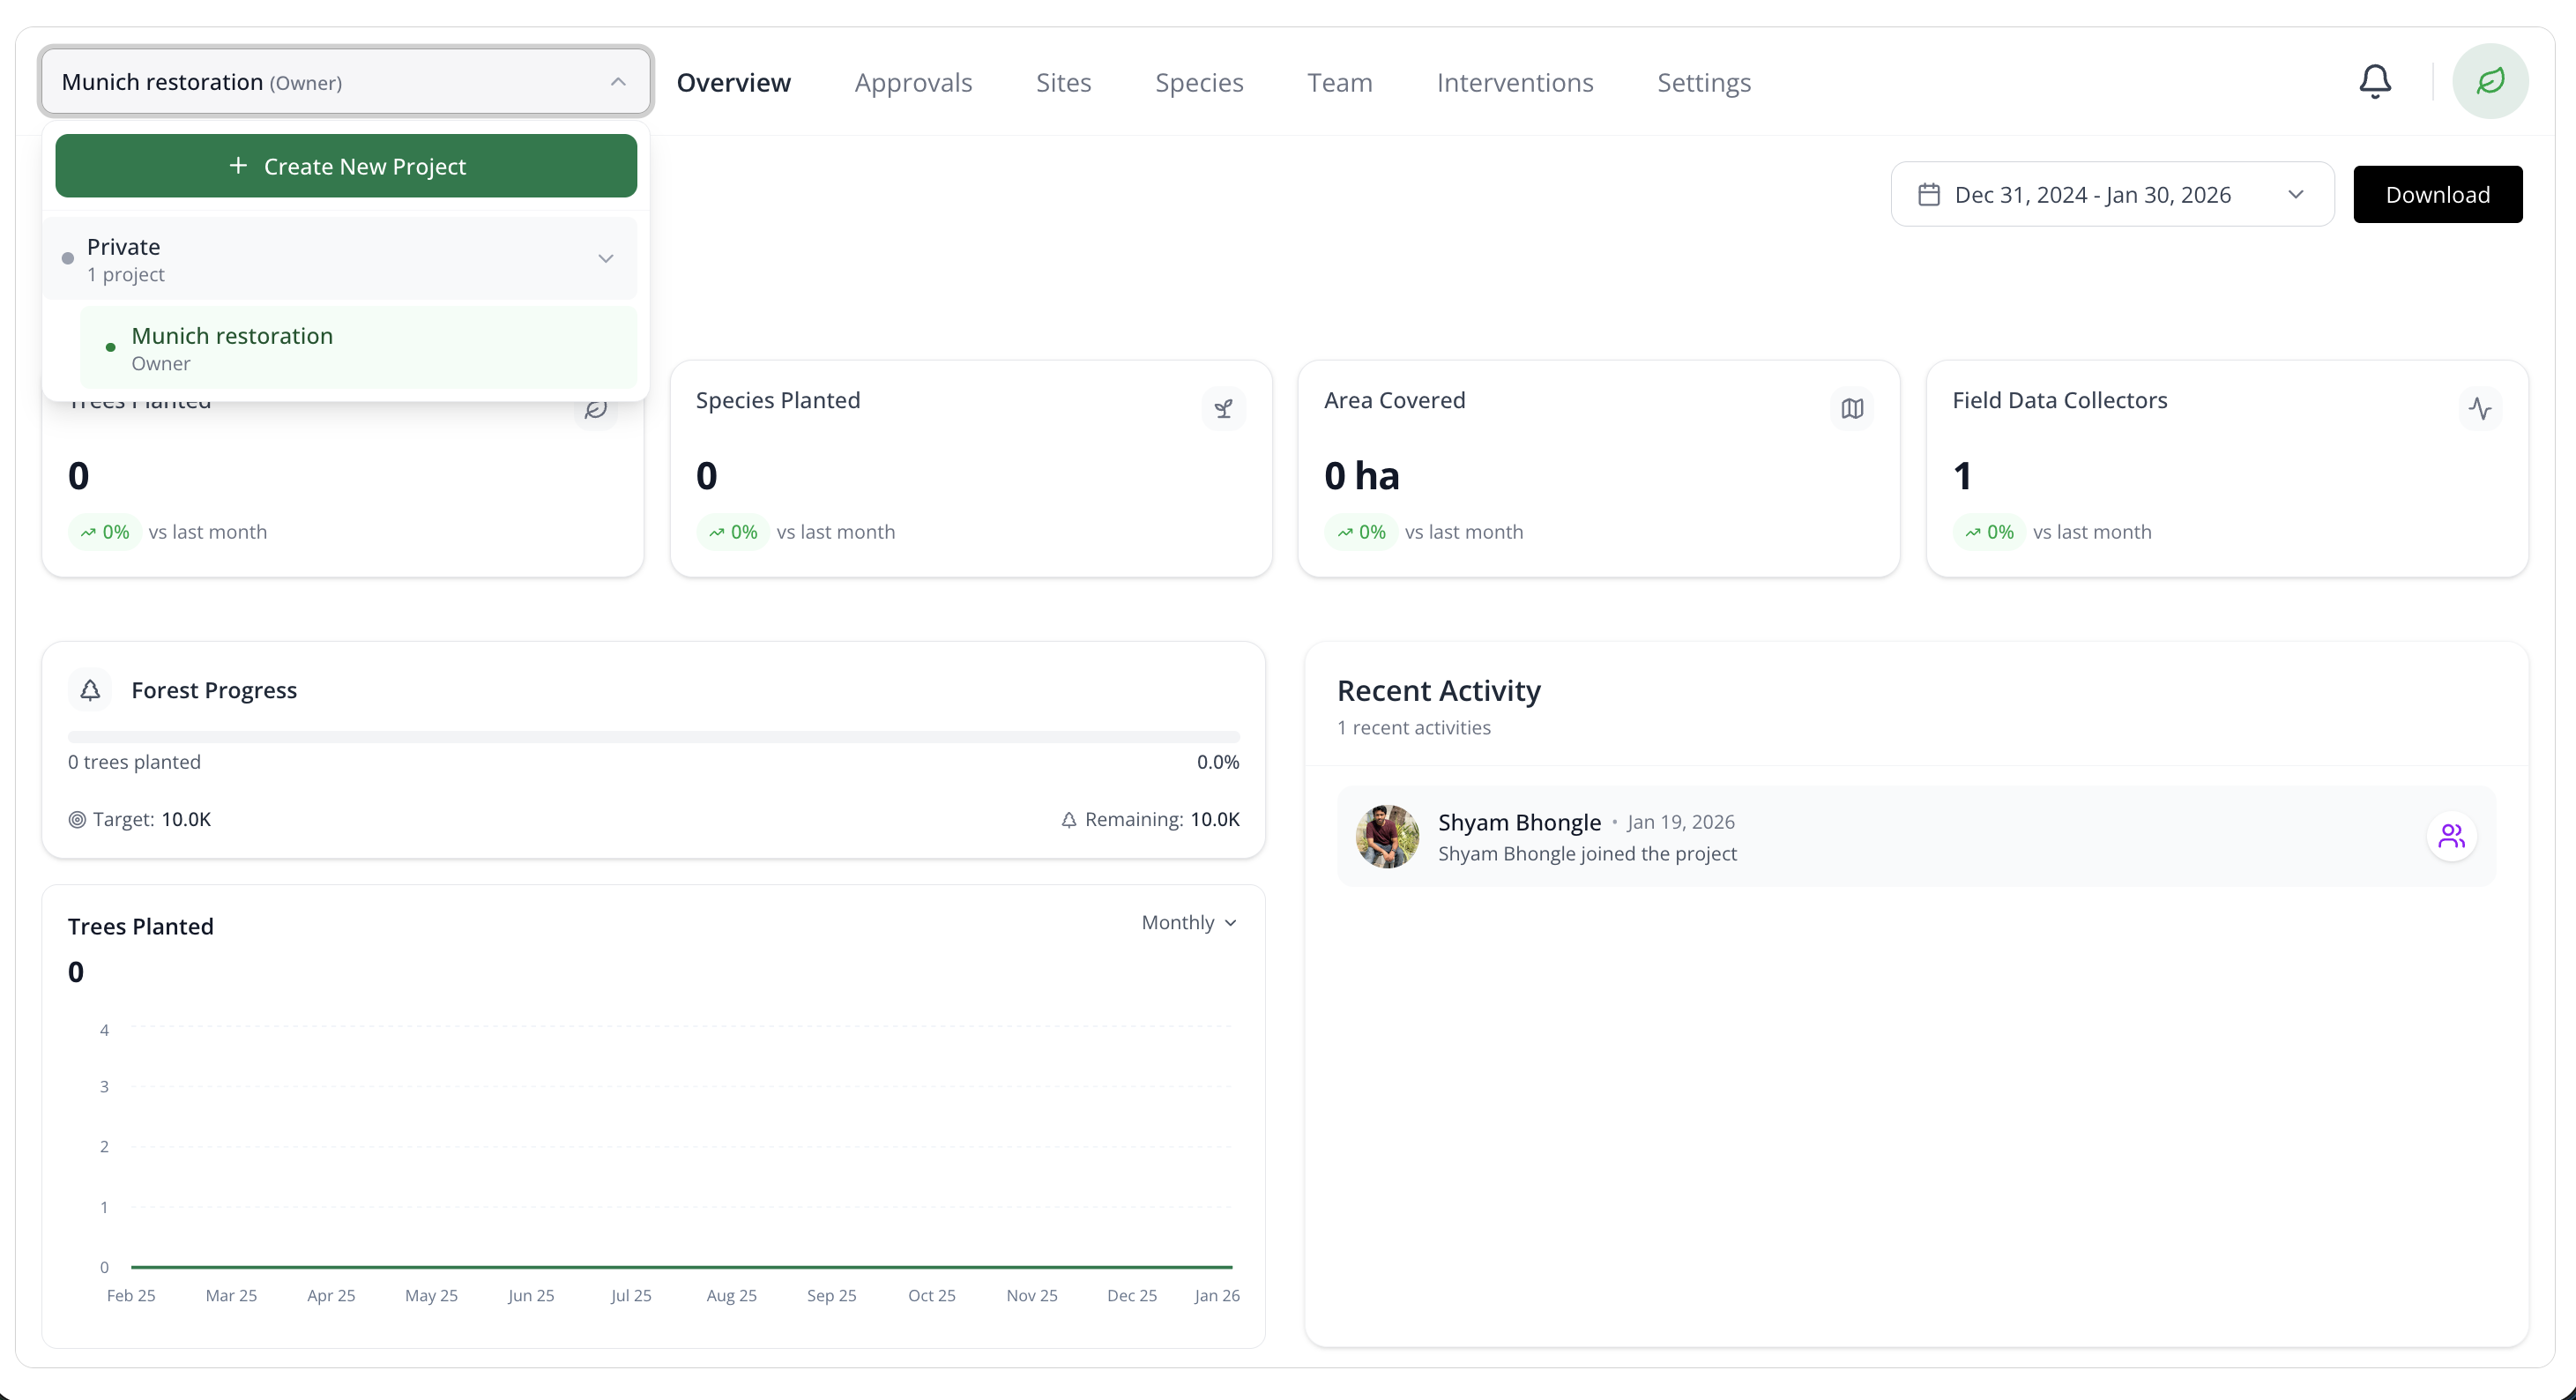
3. Select Your Project
After logging in, you'll see a list of projects you have access to. Select the project you want to work with.
Dashboard Overview
Main Navigation
The dashboard is organized into several main sections:
- Overview: Key metrics, charts, and recent activity
- Sites: Manage geographic locations within your project
- Interventions: View and manage all tree planting activities
- Species: Curate your tree species catalog
- Team: Manage users, roles, and permissions
- Reports: Generate and export custom reports
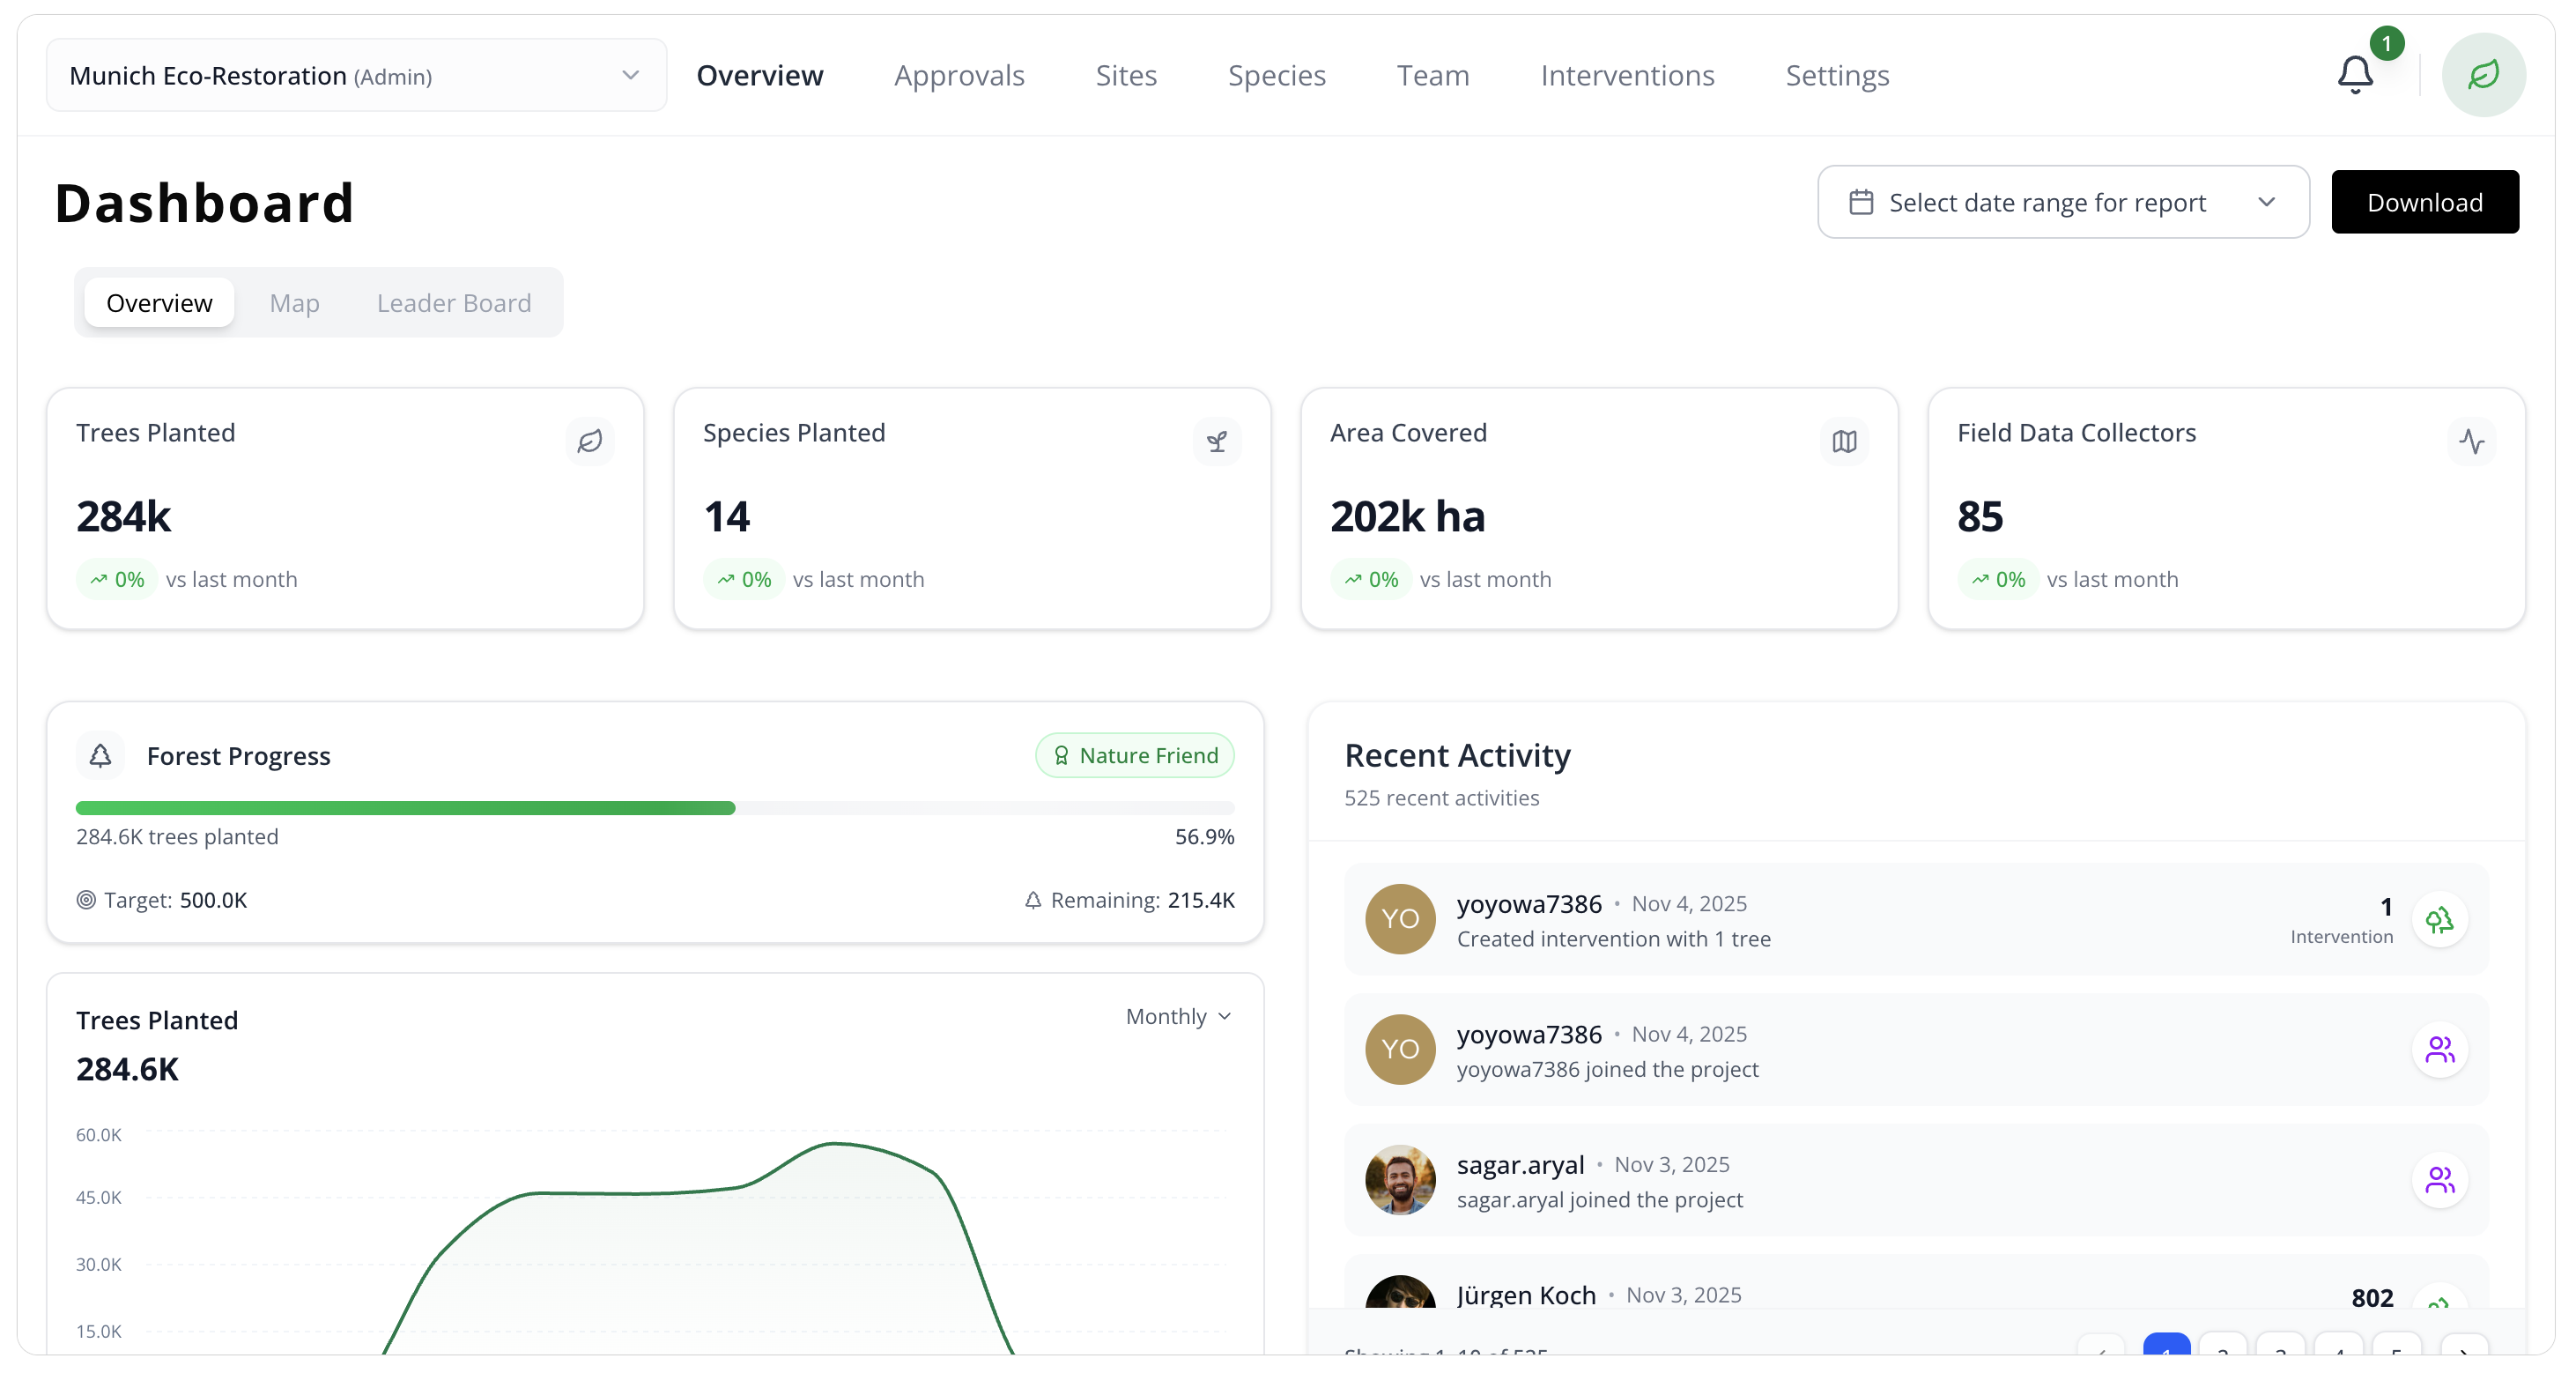
Overview Page
The Overview page provides at-a-glance insights:
- Total Trees Planted: Cumulative count across all interventions
- Active Sites: Number of sites with recent activity
- Team Members: Total users in your project
- Planting Trends: Charts showing progress over time
- Species Distribution: Breakdown by tree species
- Recent Activity: Latest interventions and updates
User Profile Setup
Update Your Profile
- Click your profile icon in the top-right corner
- Select Profile Settings
- Update your information:
- Name and display photo
- Email preferences
- Language preference
- Notification settings
- Click Save Changes
Key Features
Interactive Map
The web dashboard includes an interactive map view that displays all interventions, sites, and monitoring plots. You can:
- Toggle between satellite and map views
- Filter by intervention type, date range, or species
- Click on markers to view detailed information
- Draw custom boundaries for new sites
Data Export
Export your data in multiple formats for external analysis:
- CSV: Spreadsheet format for Excel or Google Sheets
- GeoJSON: Geographic data for GIS software
- PDF Reports: Formatted reports for sharing
Bulk Operations
Perform actions on multiple items at once:
- Bulk upload interventions via CSV
- Transfer ownership of multiple interventions
- Batch edit species information
- Mass invite team members
Permissions & Roles
The dashboard uses role-based access control:
Admin
- Full access to all features
- Manage team members and roles
- Configure project settings
- Delete or modify any data
Manager
- View all project data
- Edit interventions and sites
- Generate reports
- Cannot manage team or delete data
Contributor
- View project data
- Edit own interventions
- Limited access to team features
Viewer
- Read-only access
- View reports and analytics
- Cannot edit or create data
Mobile vs Web
| Feature | Mobile App | Web Dashboard |
|---|---|---|
| Field Data Collection | ✅ Primary use | ❌ Not available |
| Offline Mode | ✅ Full support | ❌ Requires internet |
| GPS Tracking | ✅ Built-in | ❌ Desktop only |
| Analytics & Reports | ⚠️ Basic view | ✅ Full features |
| Bulk Operations | ❌ Not available | ✅ Full support |
| Team Management | ❌ Limited | ✅ Full control |
| Data Export | ❌ Not available | ✅ Multiple formats |
Next Steps
Now that you're set up on the web dashboard:
- Explore the dashboard overview to understand key metrics
- Invite team members to collaborate
- Generate your first report to analyze progress
- Create sites to organize your work
Need Help?
If you encounter issues accessing the dashboard, check our troubleshooting guide or contact support.